Tech team · Data platform engineering

Data platform engineering: right-size the clusters that feed the lakehouse

Data platforms run heavy batch and stream workloads on Kubernetes—often many clusters per region. FusioNative shows capacity, namespace consumption, and fleet health so data infra teams scale before pipelines queue.

Capacity and multi-cluster stacks for data platforms

Plan headroom and operate multi-cluster data stacks with the same control plane as the rest of engineering.

Who needs this

  • Data platform SREs and infrastructure engineers
  • Owners of Spark/Flink/airflow-on-K8s style footprints
  • FinOps partners allocating cost to data products

Industry pressures (why change)

  • Batch spikes exhaust nodes but metrics are divorced from scheduler view
  • Multiple analytics clusters duplicate tooling and blind spots
  • Finance asks for chargeback data platform cannot produce quickly

Why FusioNative fits

  • Capacity planning ties trends to limits and forecasts
  • Namespace and pod analytics show top consumers
  • Tenant metering supports chargeback to data products

How teams adopt it

  1. Step 1. Inventory analytics clusters in the fleet view
  2. Step 2. Review capacity forecasts before major pipeline releases
  3. Step 3. Throttle noisy namespaces via quotas visible in tenant tools
  4. Step 4. Export utilization narratives for FinOps monthly
In Cloud Admin

What Data platform engineering teams see in the product

Real screens—how and why each view matters for your sector.

Capacity planning
01 of 03 Cloud Admin

Capacity planning

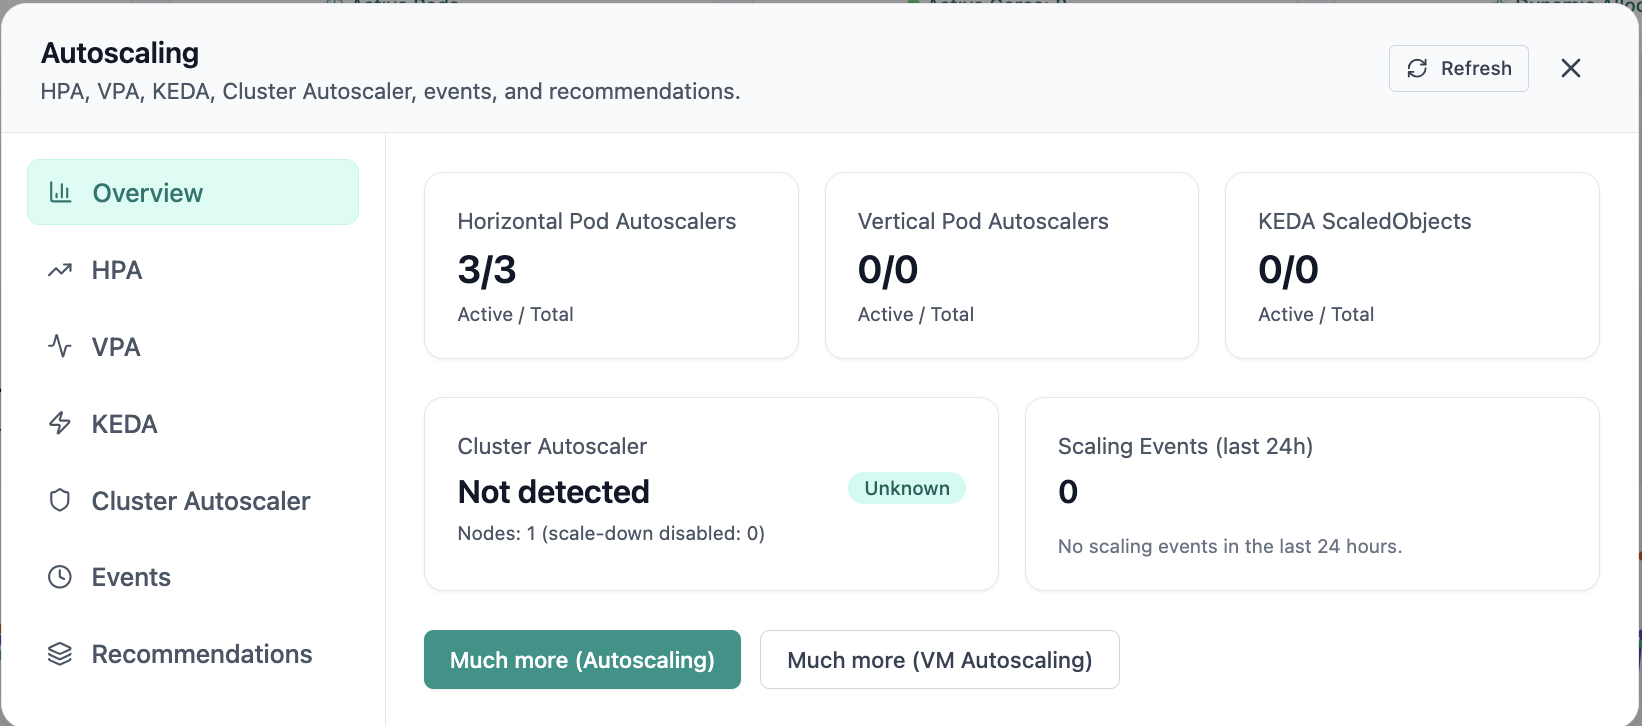
Forecasts and headroom—plan nodes before Black Friday-scale batch jobs.

  • Trend vs limit
  • Scenario thinking
  • Shared language with finance

Click to zoom and pan the screenshot.

Namespace resources
02 of 03 Cloud Admin

Namespace resources

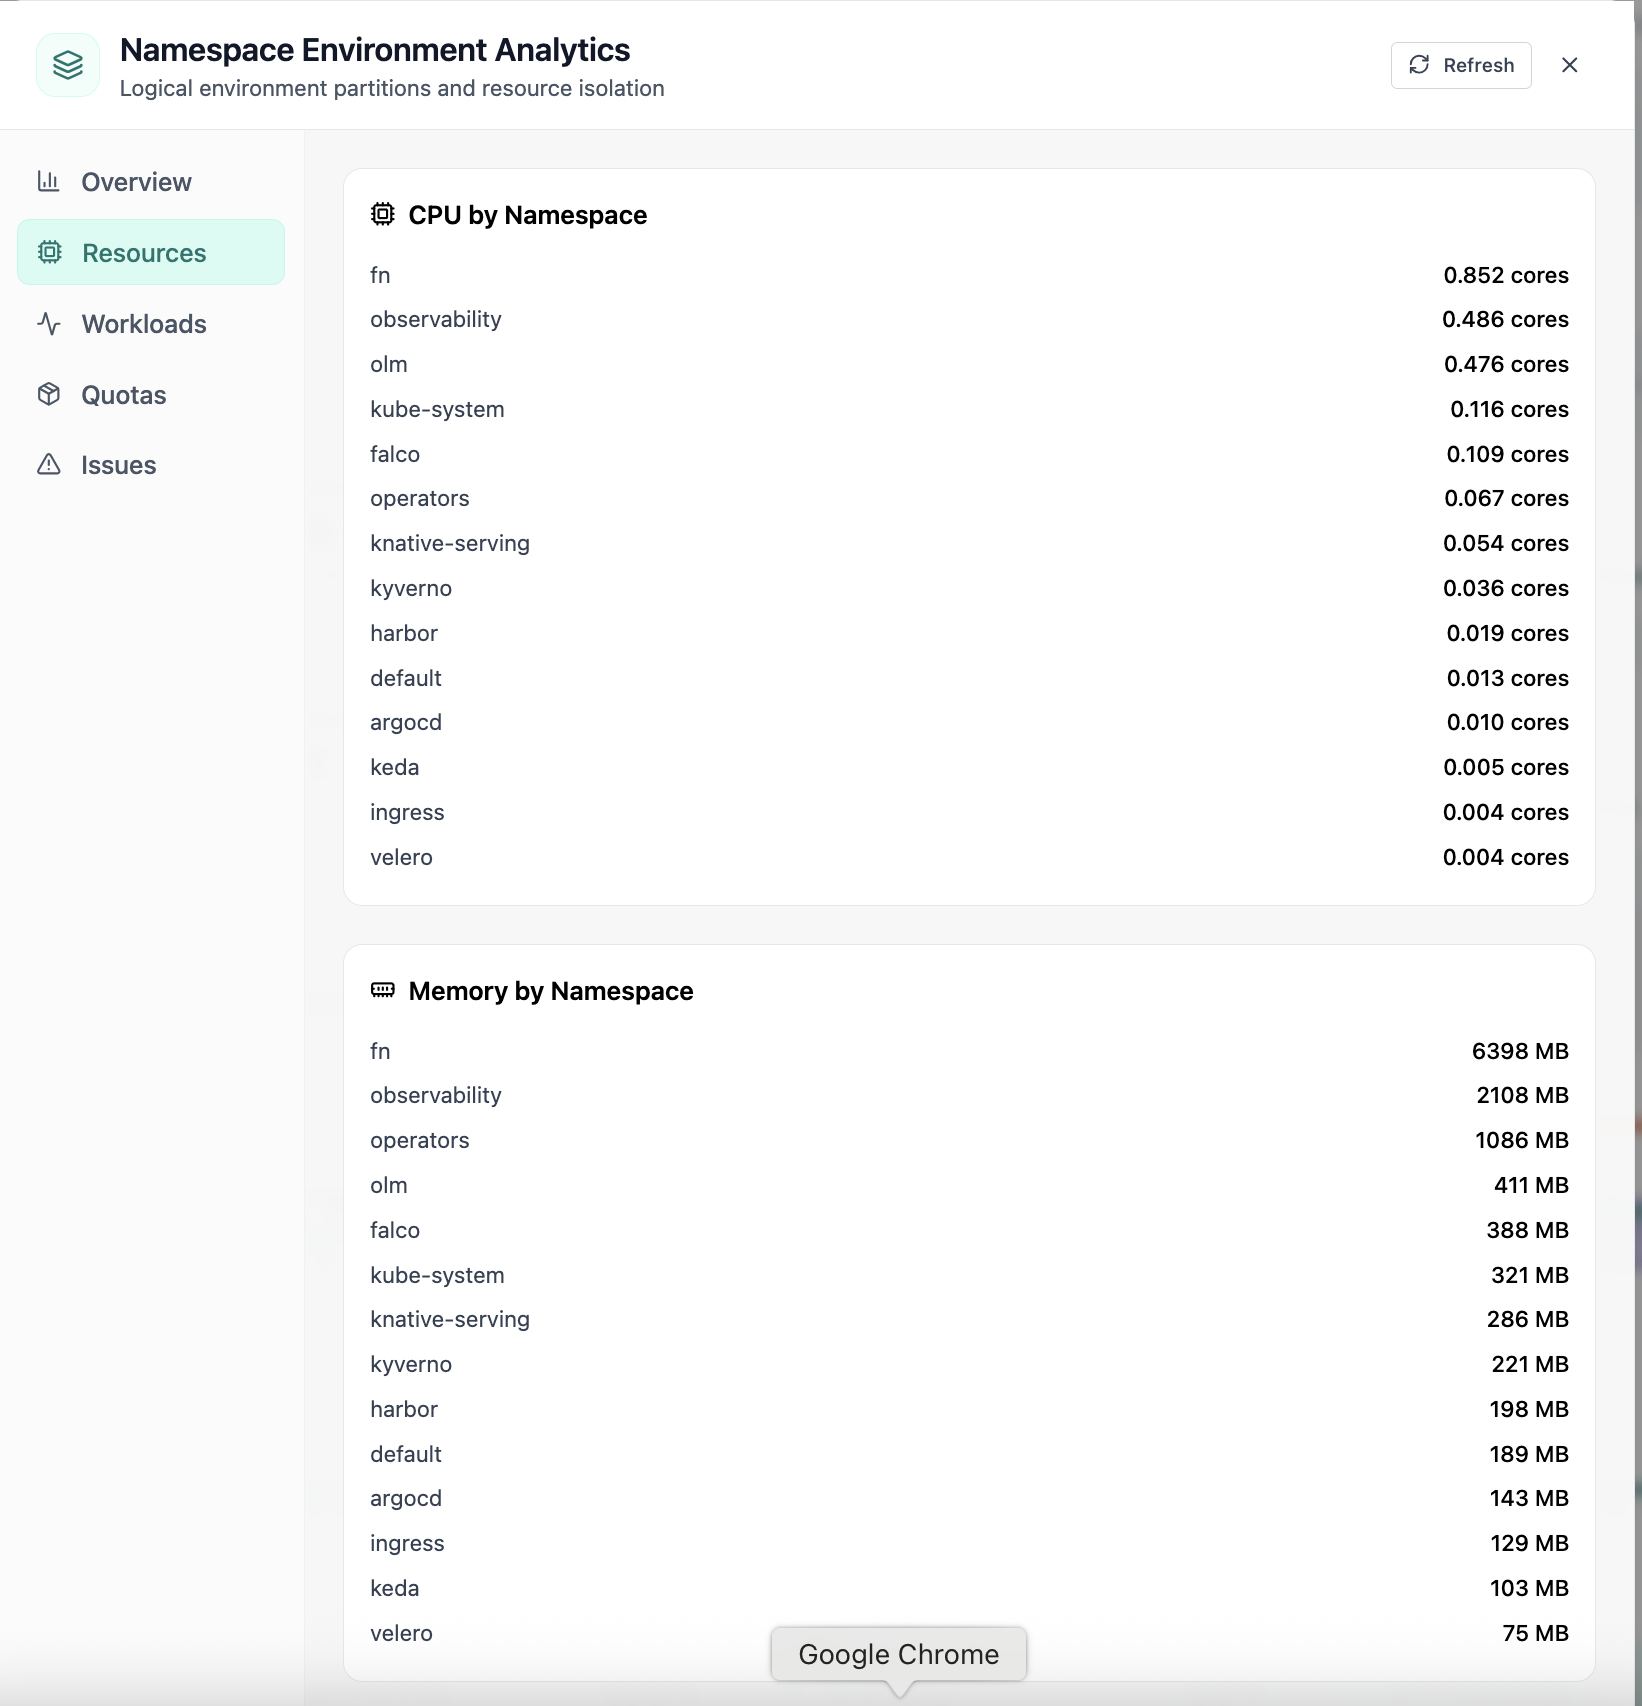
CPU and memory by namespace—identify the job blowing the pool.

  • Sorted consumers
  • Quota alignment
  • Faster triage

Click to zoom and pan the screenshot.

Cluster dashboard
03 of 03 Cloud Admin

Cluster dashboard

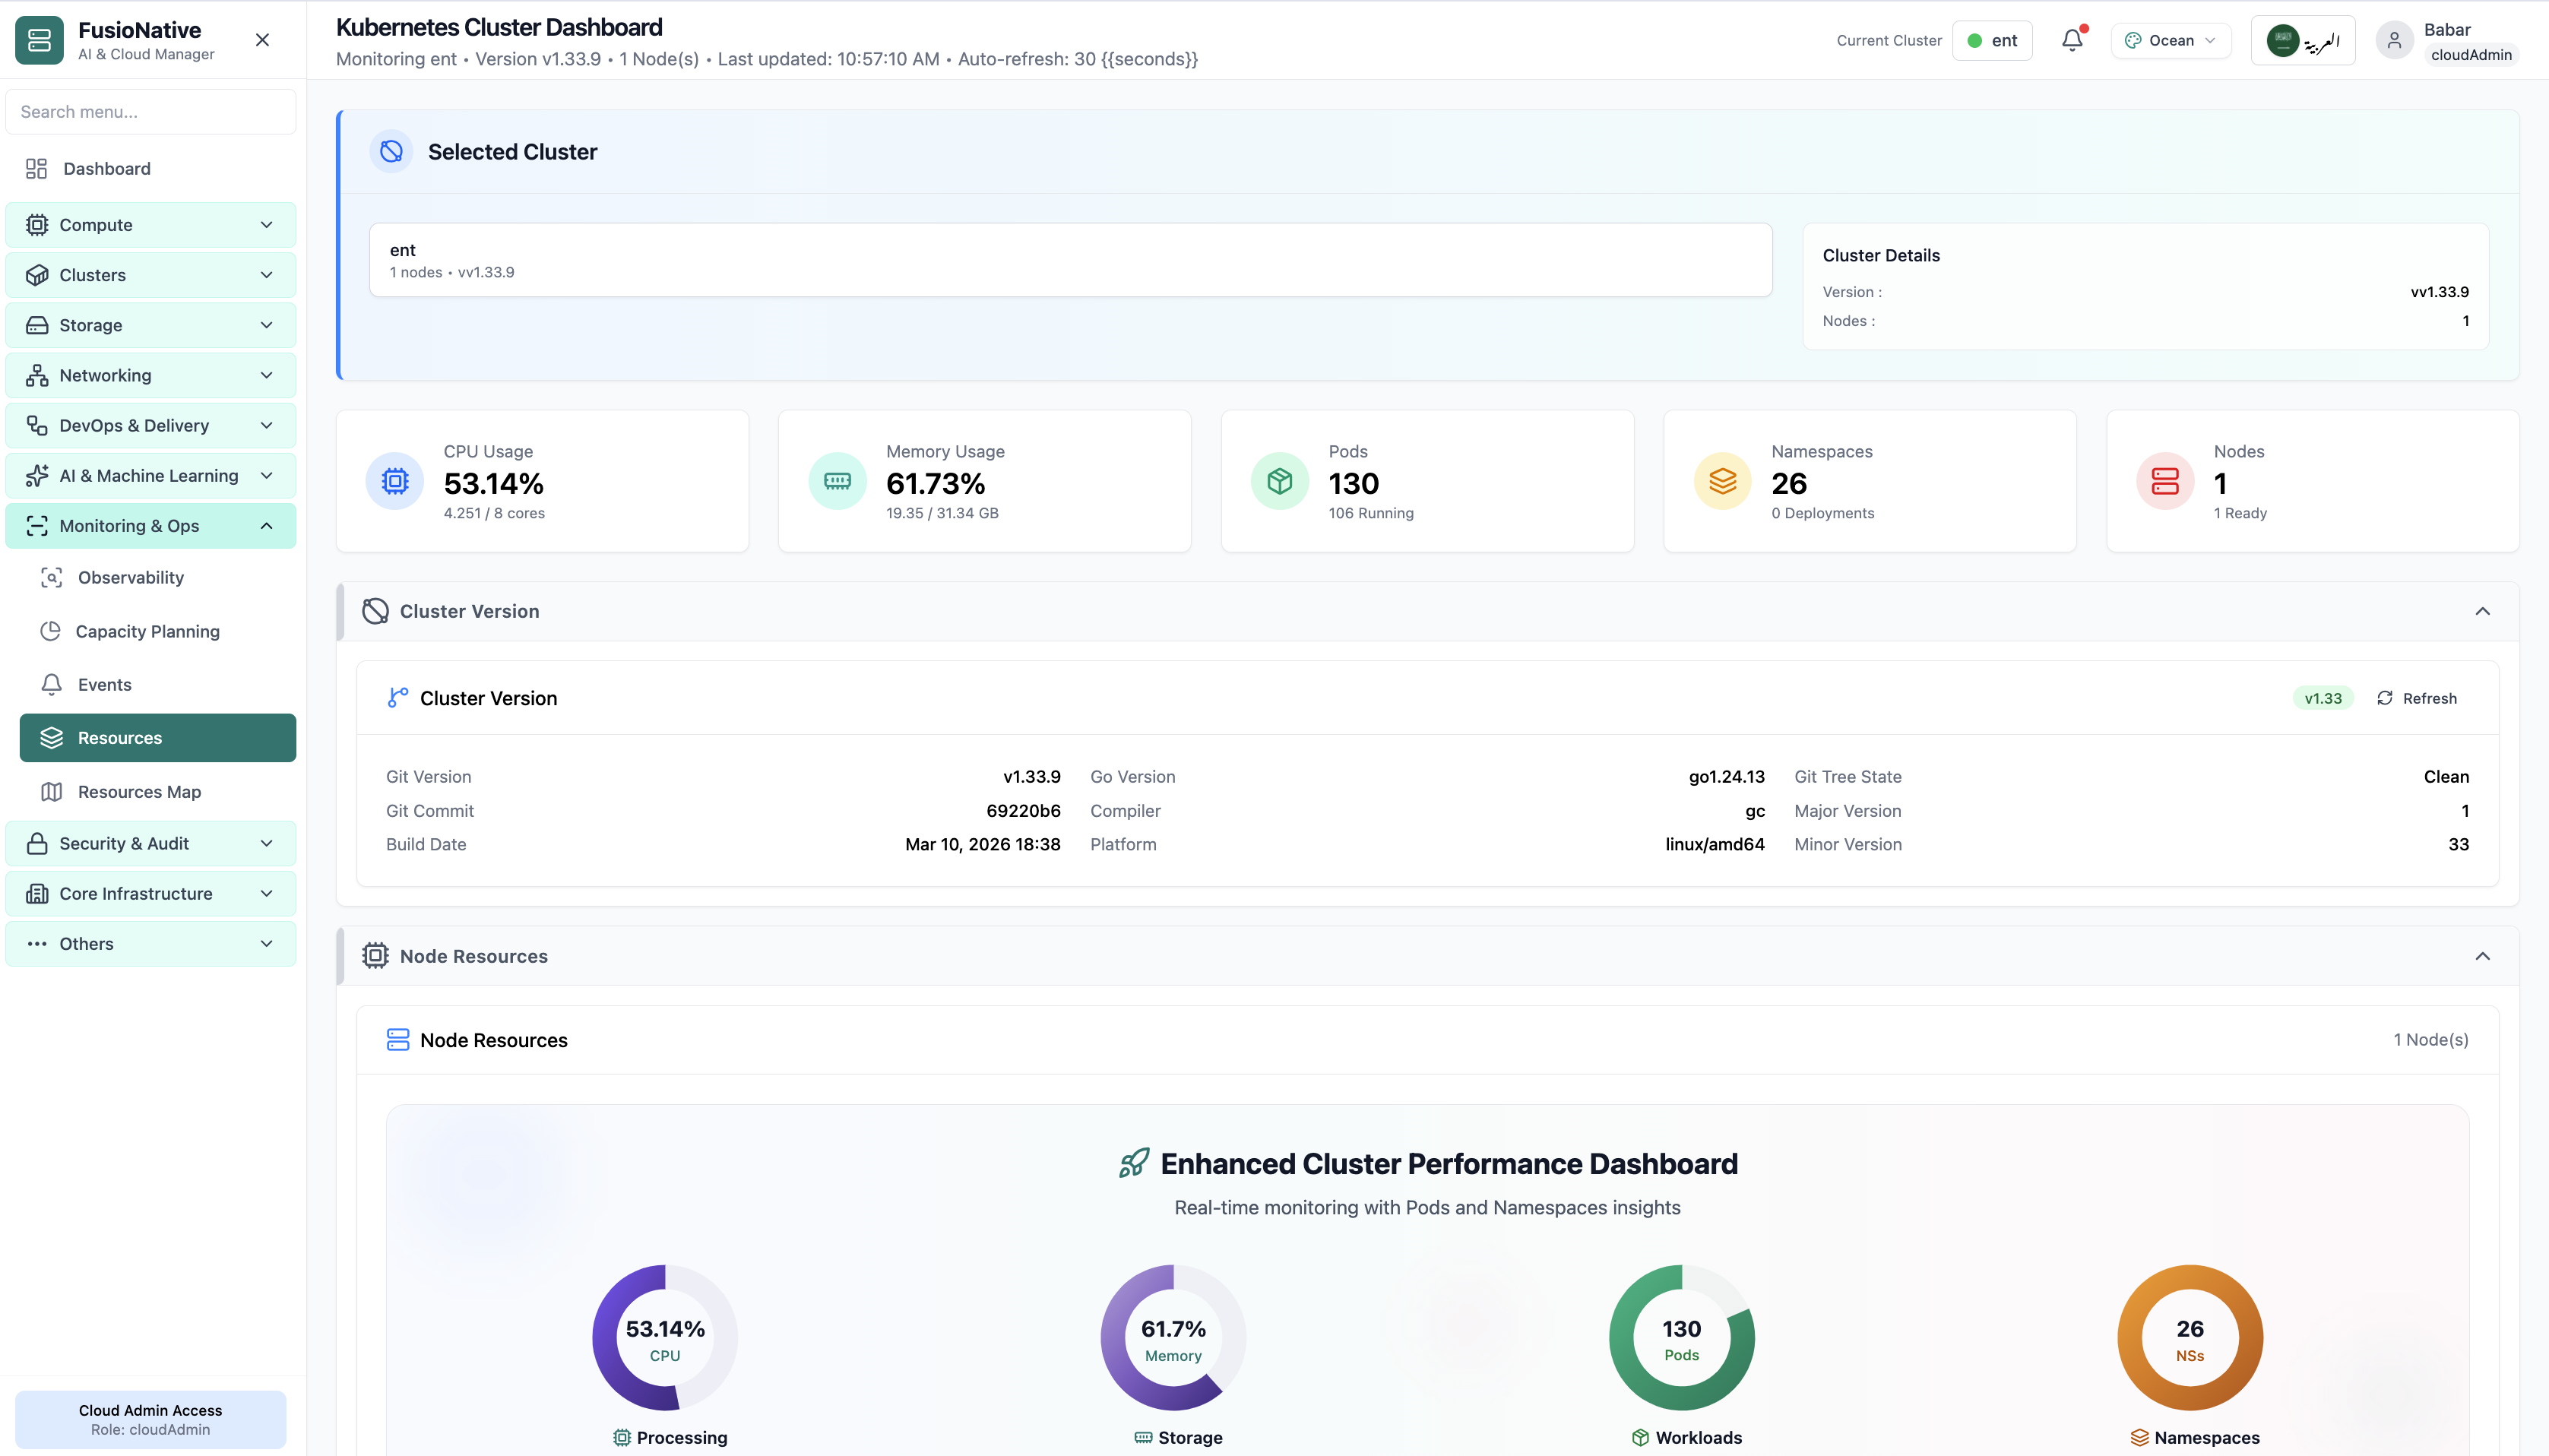
Cluster-level gauges for CPU, memory, pods, and nodes—ops snapshot for data sites.

  • Single-cluster focus
  • Node and pod counts
  • Bridge-ready numbers

Click to zoom and pan the screenshot.