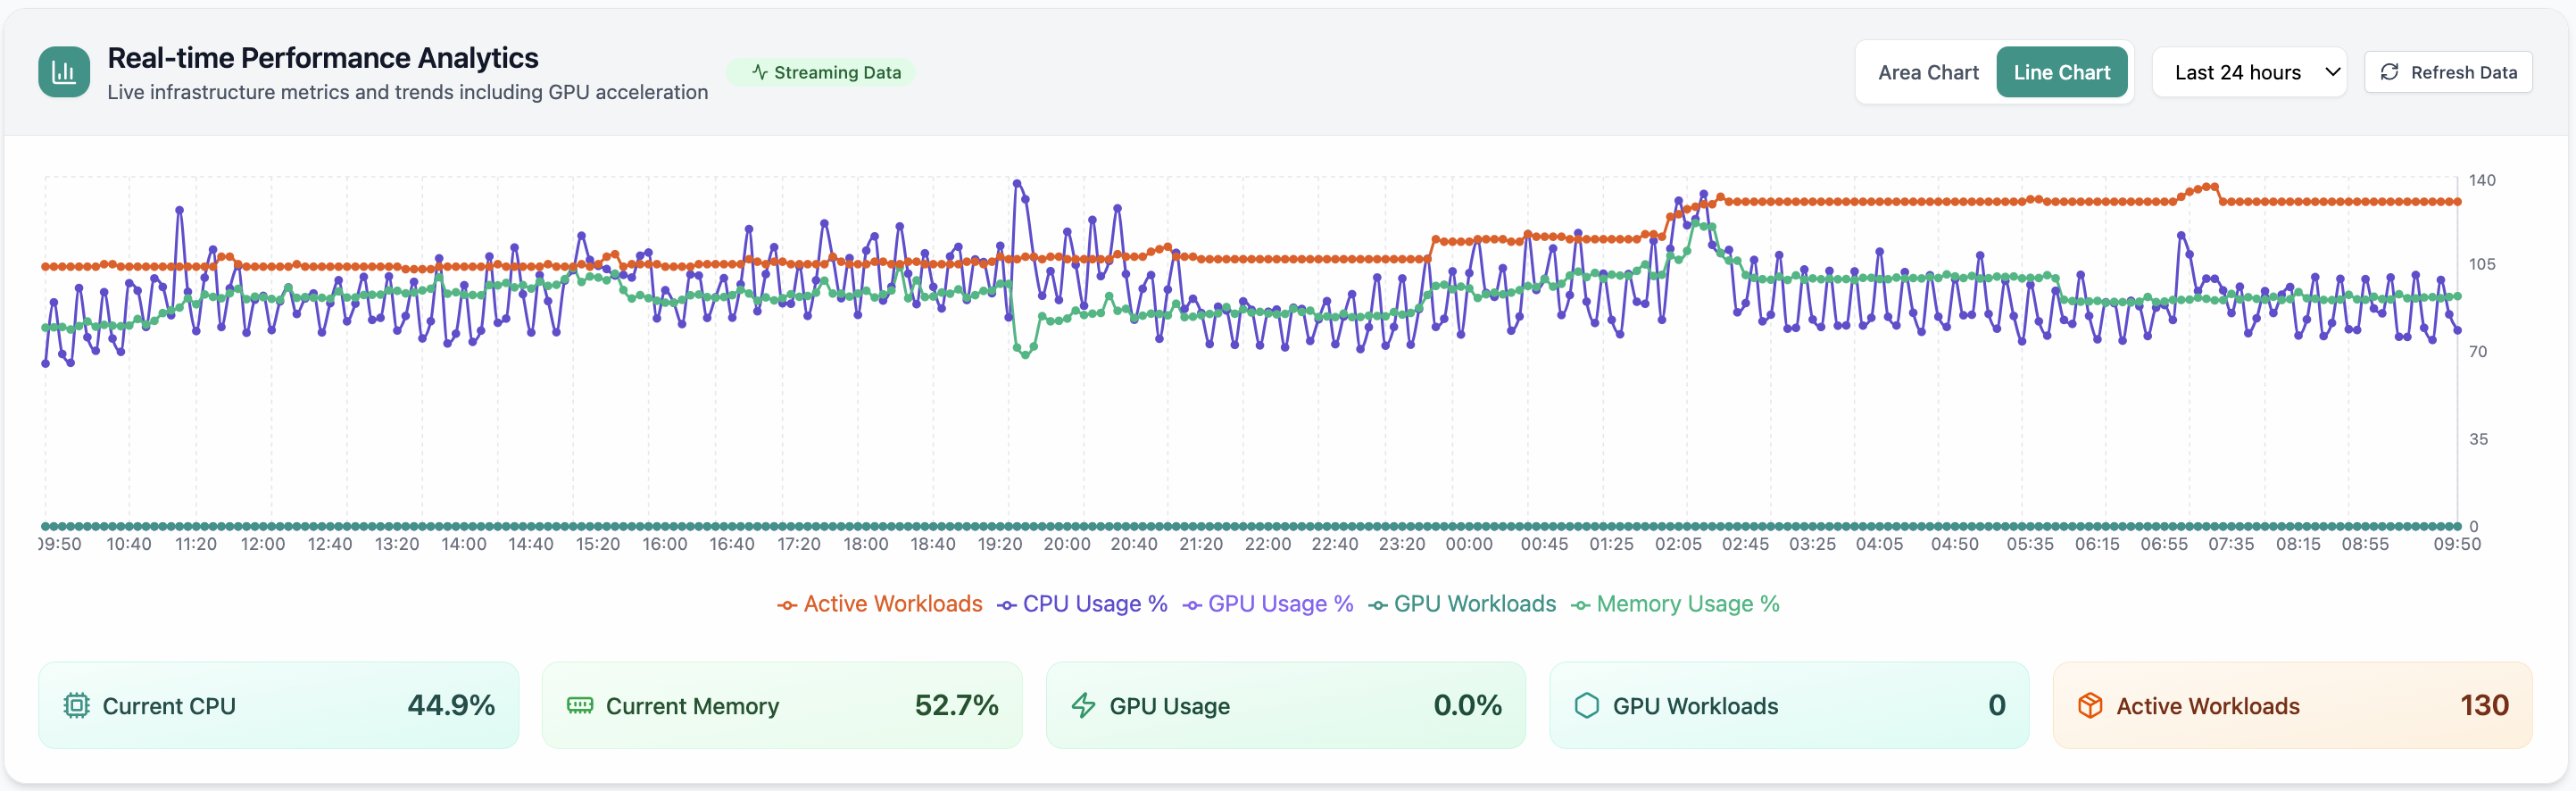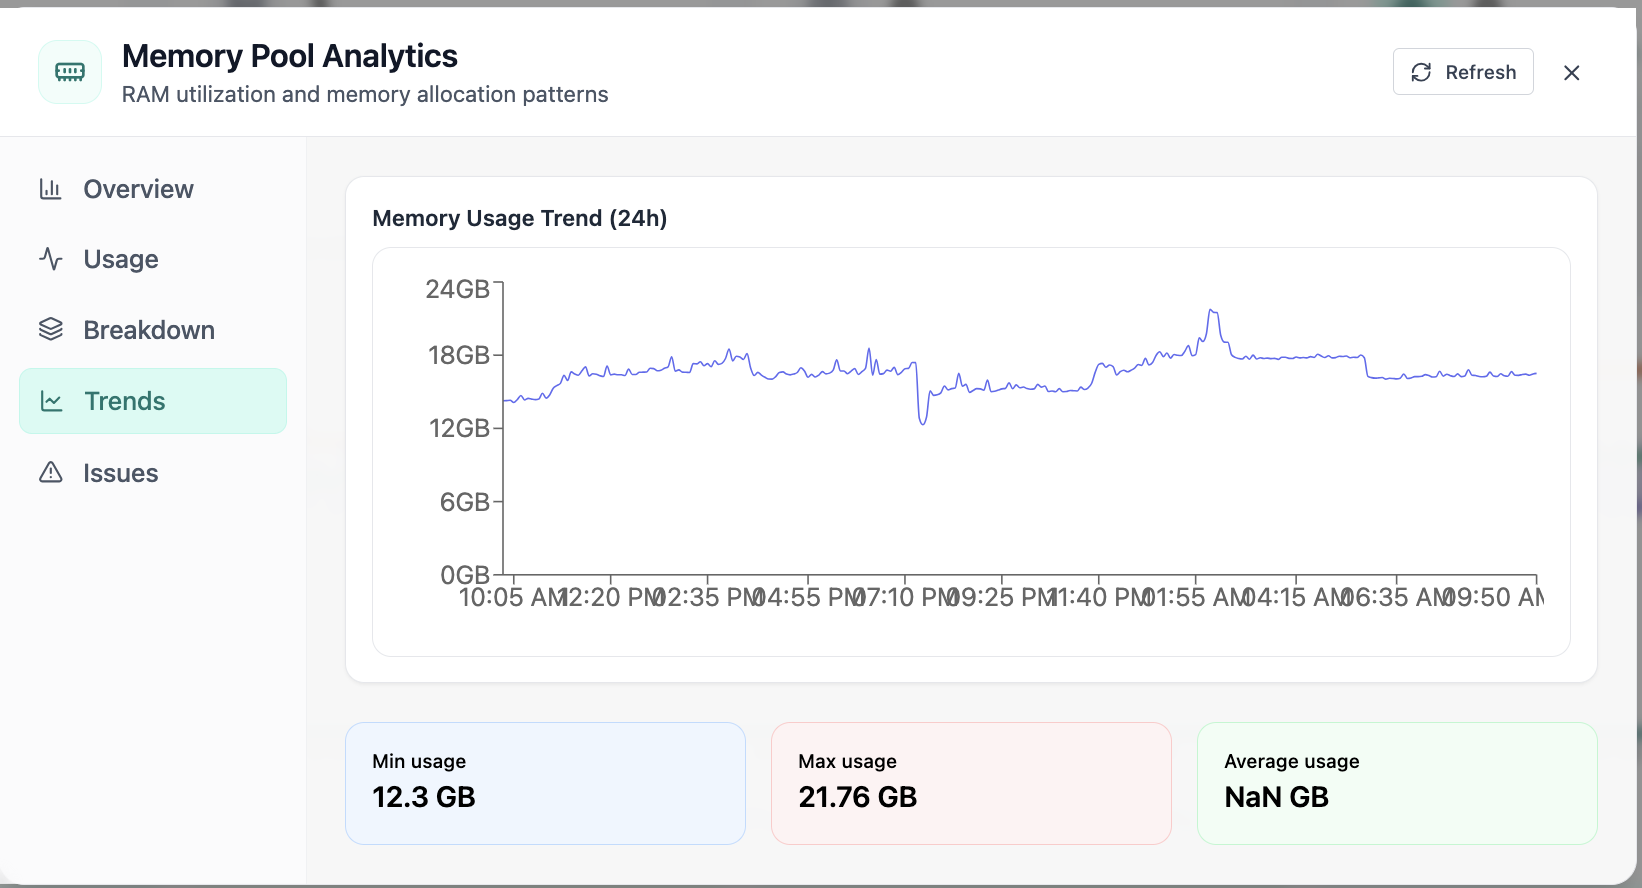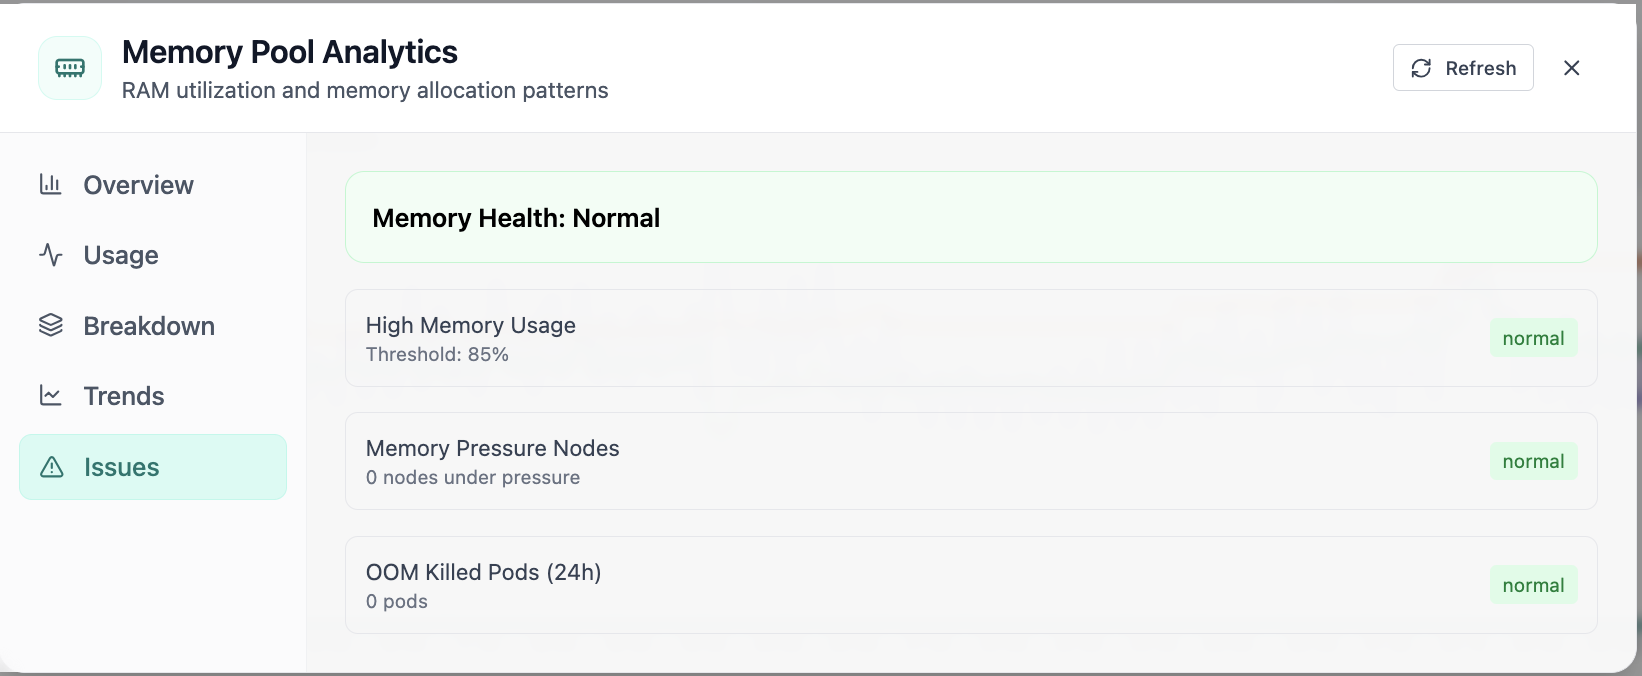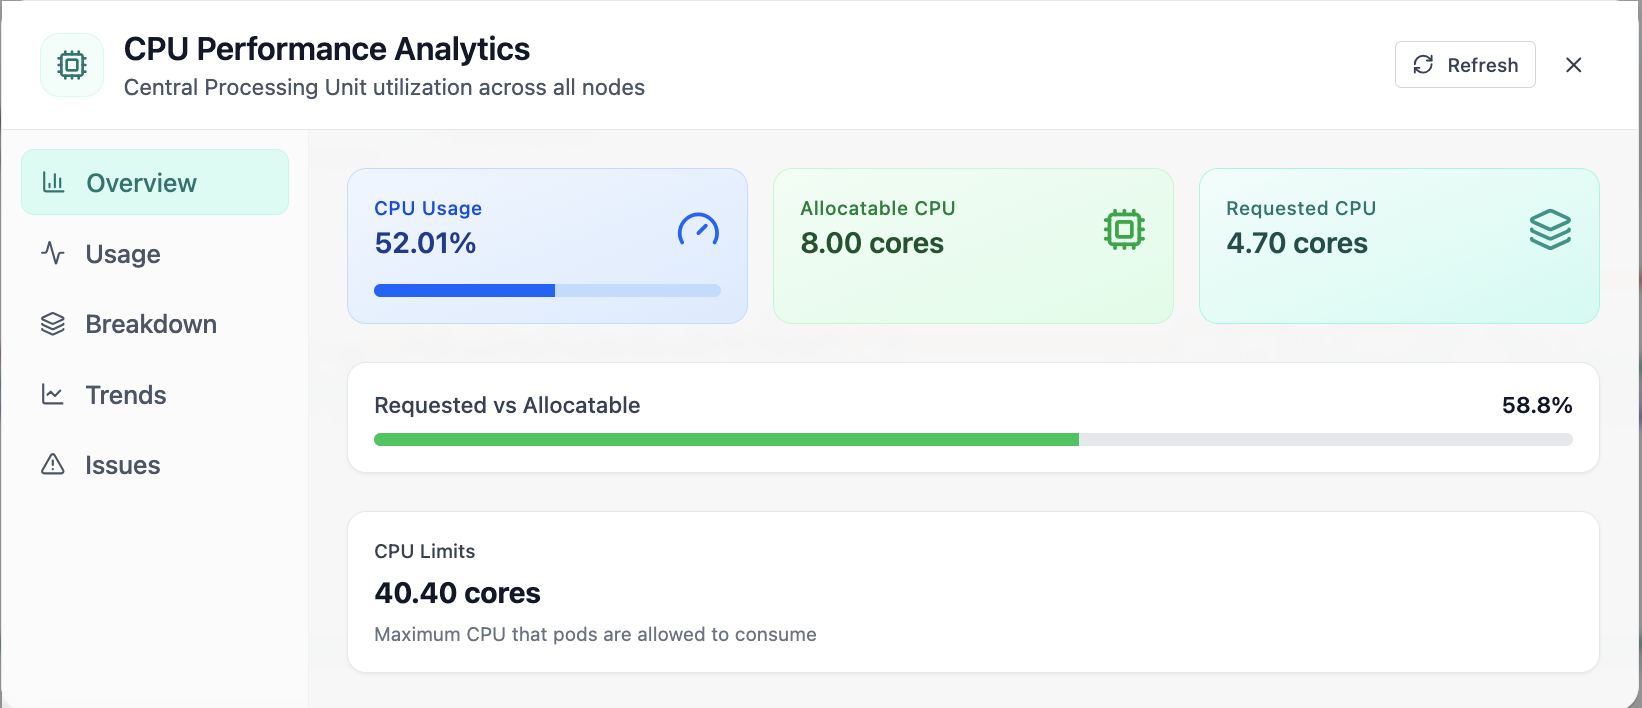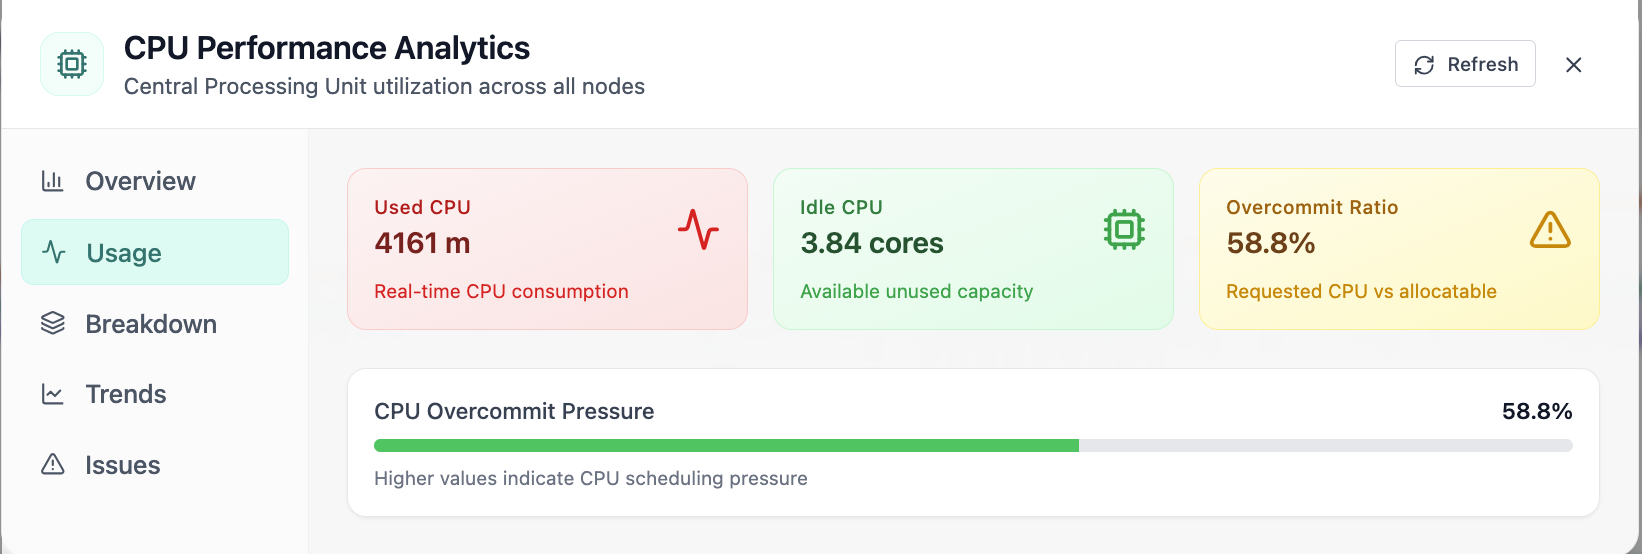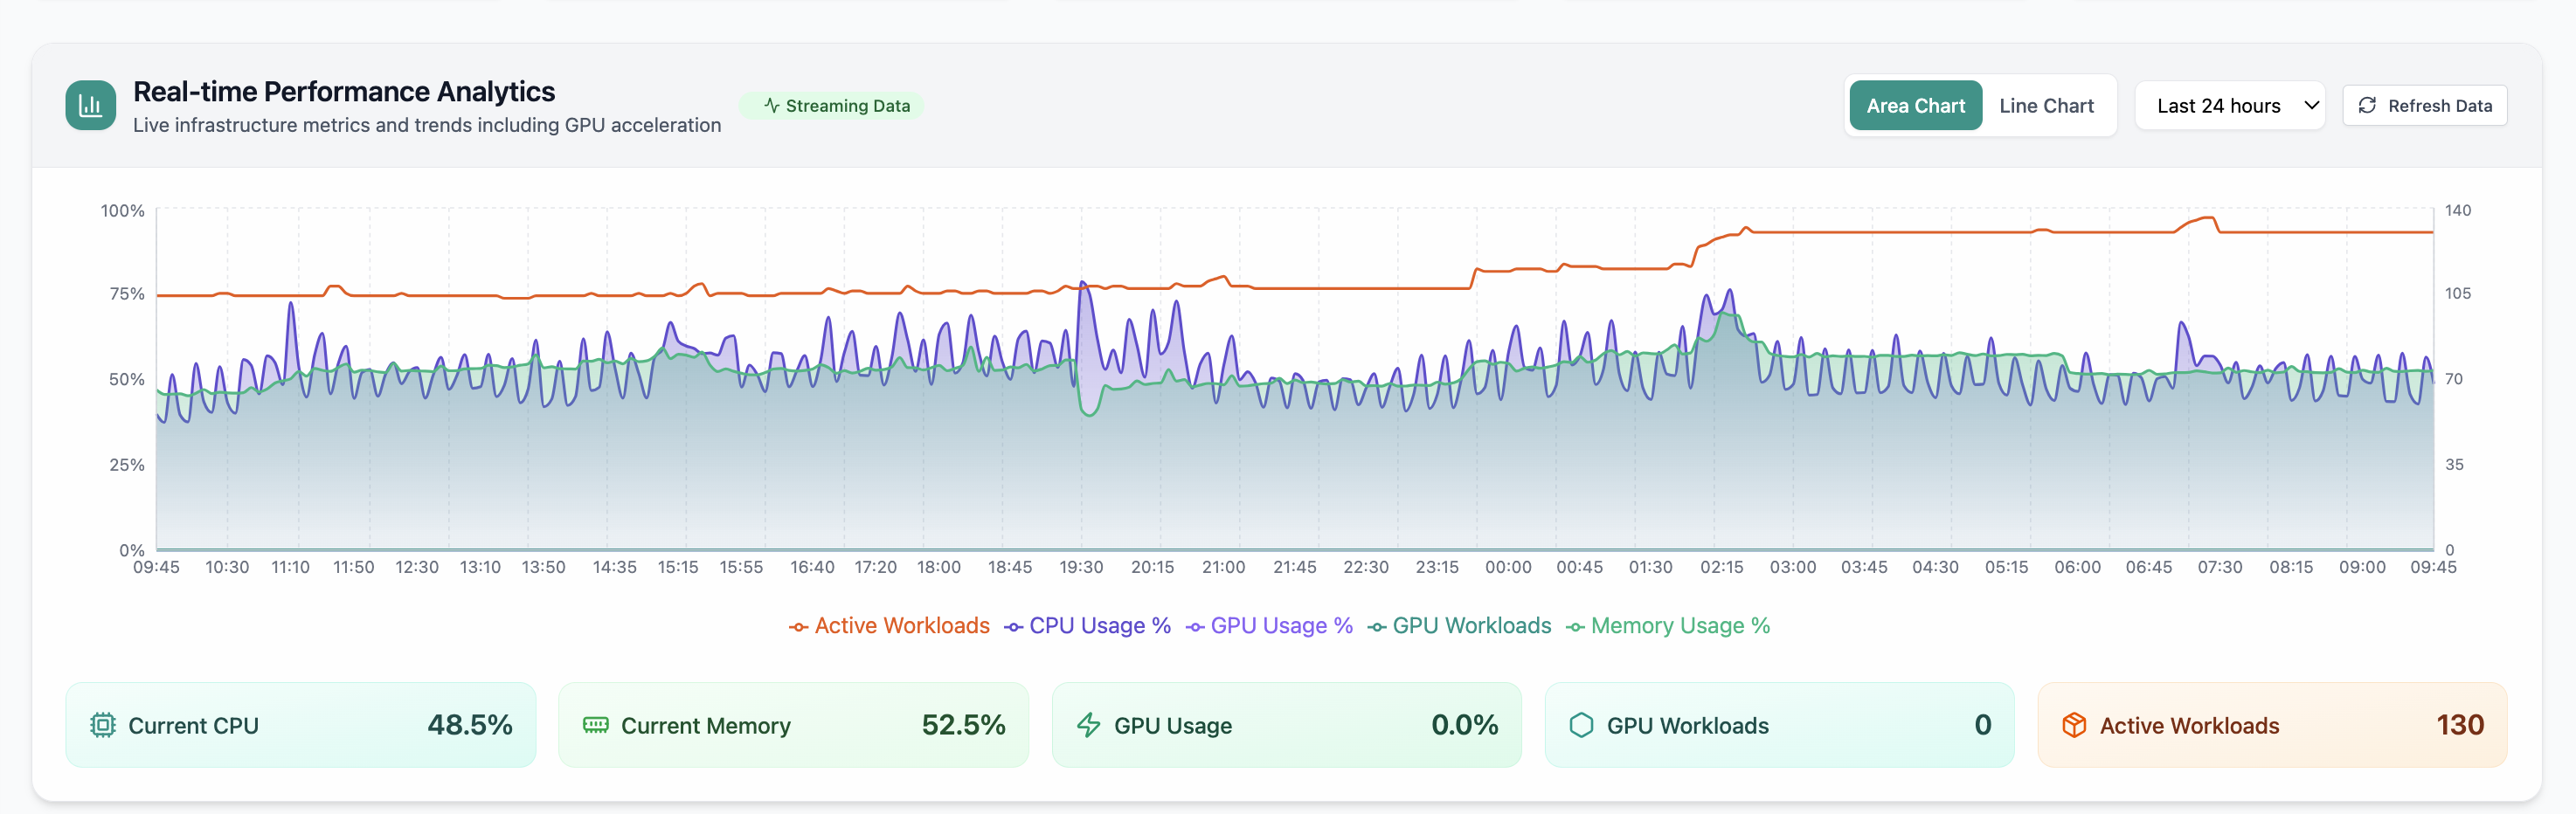
Real-time Performance Analytics
Real-time Performance Analytics area chart for CPU, memory, GPU, and workloads over 24 hours. Real Cloud Admin UI for Monitoring workspace—what operators see daily and what to do next.
- GPU and inference signals stay beside Kubernetes metrics
- Dense data stays readable at full size (click to zoom)
- Fits into the broader FusioNative operational workflow
Click the screenshot to open full size, zoom, and pan.